Streamlining the complexity of fixed income
A lightweight, logic-driven workstation for MarketAxess.
This project is a retrospective interpretation of institutional trade execution and high-density data systems influenced by my time at MarketAxess. It's designed to address the unique complexities of bond trading, and simplify a trader's workflow.
Introduction
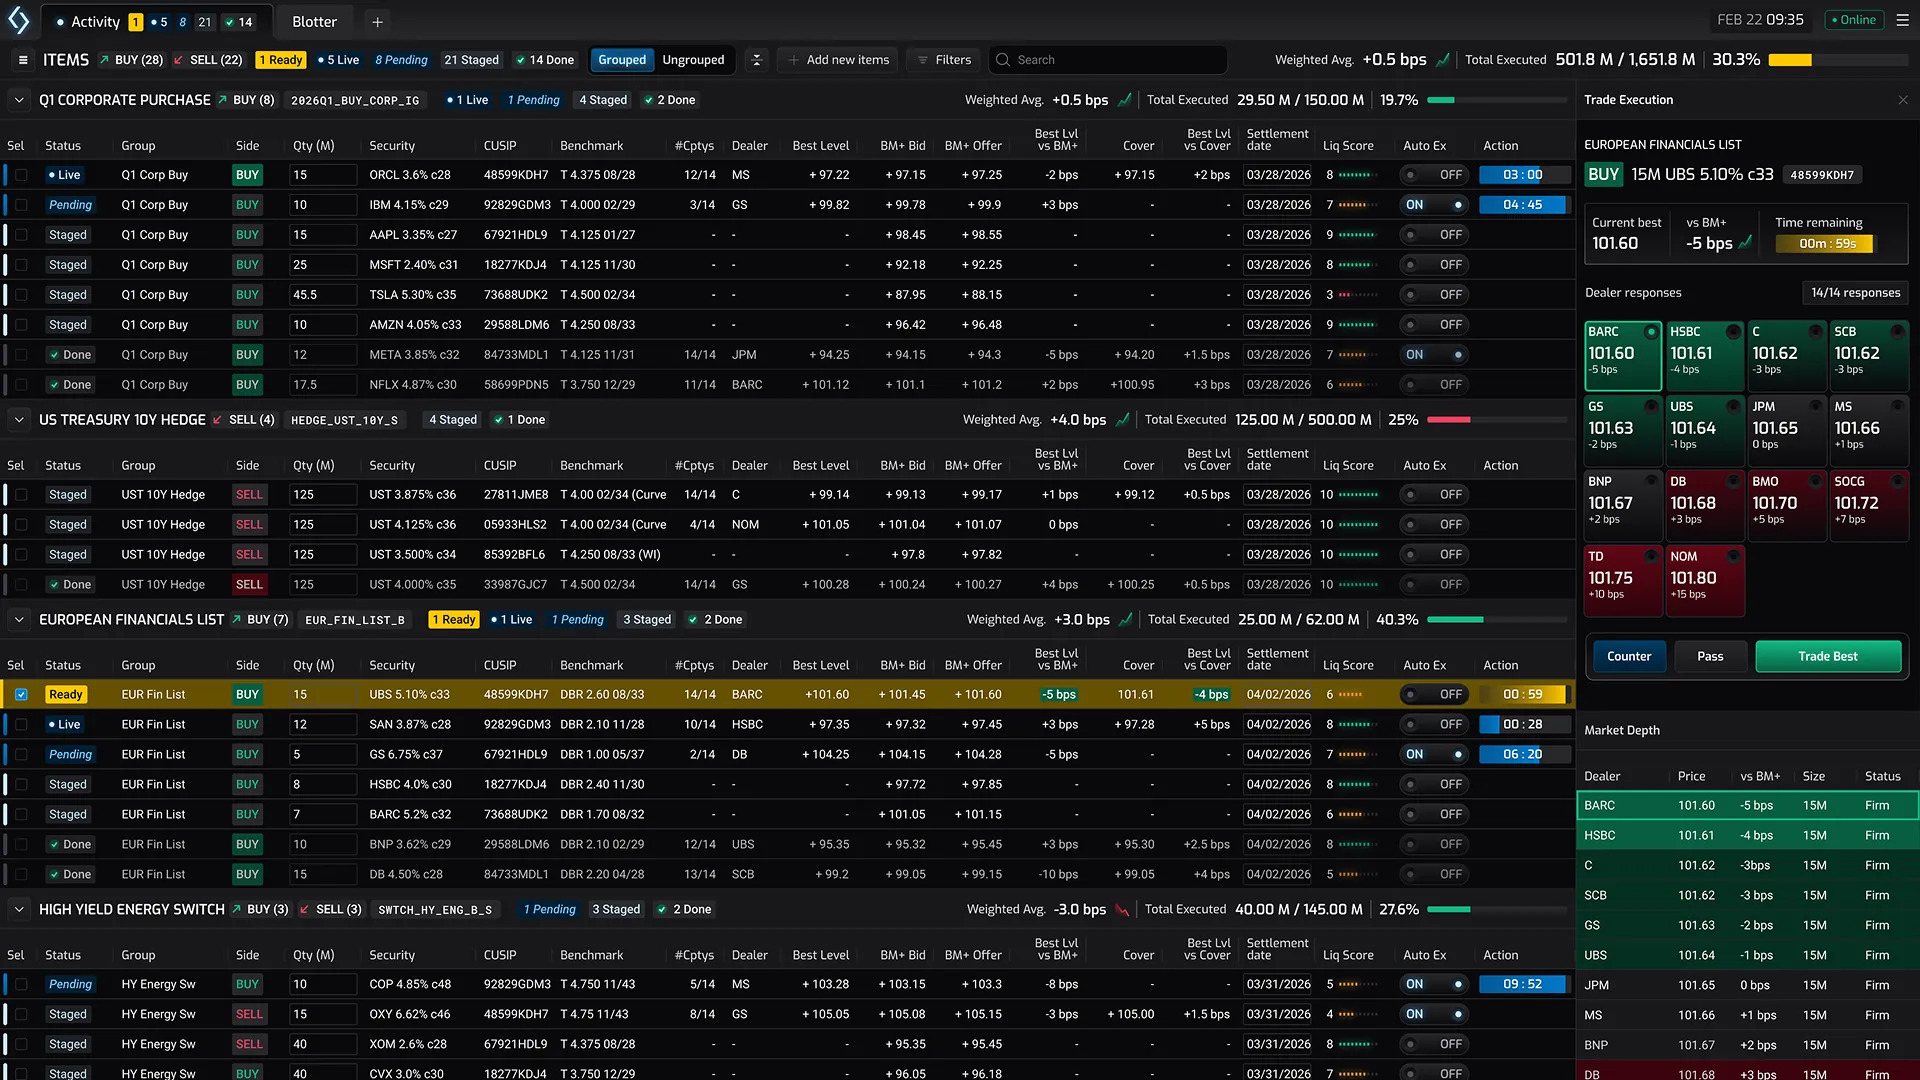
As Senior UX Designer, I collaborated with a specialist team of developers and product specialists to deconstruct years of legacy feature-bloat. Our mission was to develop a new, React-based execution platform from the ground up.
By distilling fragmented workflows into a cohesive visual language and a centralised component library, the team transformed a dense, ‘bolted-on’ ecosystem into a lightweight, logic-driven interface that streamlines established trading patterns.
Flow breakdown: the stages of a trade
Overview
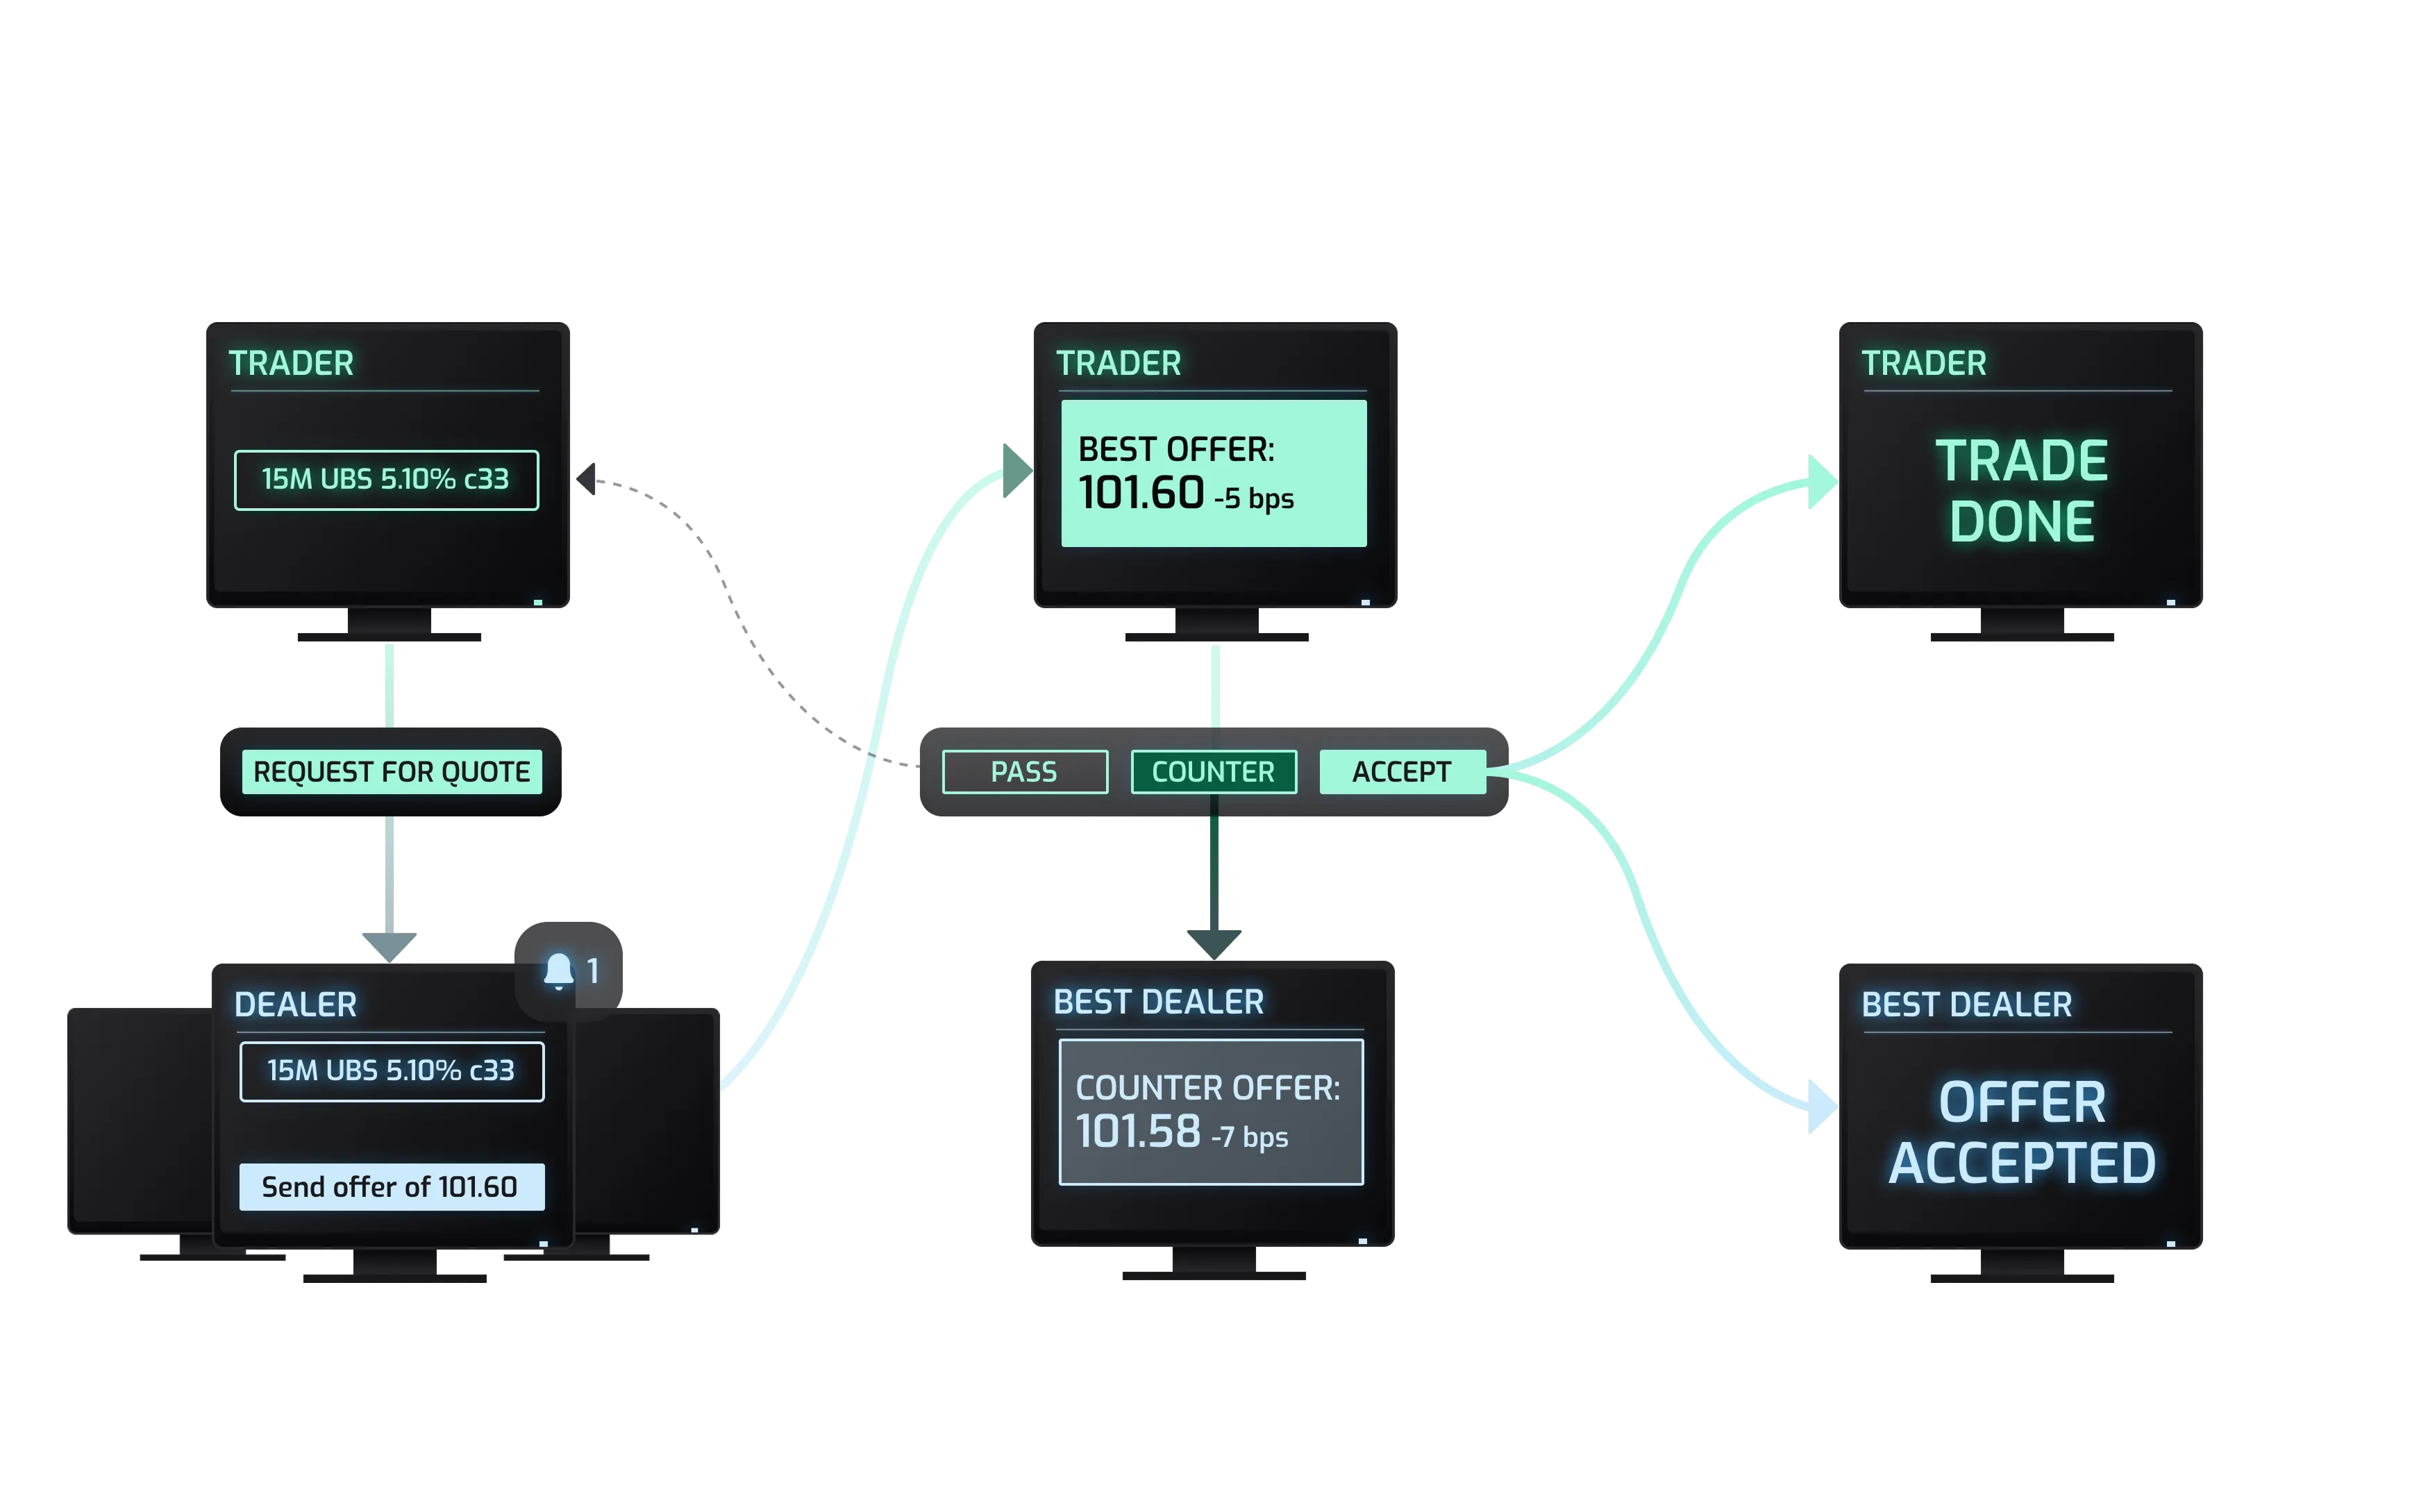
In institutional finance, bonds are traded "over-the-counter," requiring a negotiation process known as a Request for Quote (RFQ). A trader's workflow is fast-paced: they stage multiple bonds, seek competitive pricing from a global network of dealers, and analyse incoming quotes against real-time benchmarks.
Request for quote
When the trader selects an order, the details panel slides into view. Here they can configure their trade before submitting their request. Importantly, this is the stage where the trader is able to decide which dealers / counterparties they'd like to send their request to.
Once the trader is ready, they can hit the Send RFQ button which takes the order to the next stage.
Dealers receive the RFQ
Once the trader submits an RFQ, it's sent to all the relevant dealers. During this stage the order's status is 'Pending', meaning the order is with the dealers but no responses have been received yet.
The dealer selection pills transition to represent a tile on the heatmap, however until a response is received, each tile displays a pulsing empty state.
Trader receives quotes from dealers
Now the order is 'Live'. The trader's UI shows a surge of activity in the heatmap and a market depth grid. Some early offers appear bright red telling the trader these offers are well over the benchmark prices for this bond, but as the end of the live window closes in, the field is looking a lot more competitive.
Ready to trade
The live window has now closed and the order moves to a ready to trade status. The entire row is highlighted in gold to reinforce urgency. The best quote is at the top of the stack and highlighted with a bold green border.
At this stage, the trader has a number of options:
- Trade with the best dealer
- Select any other dealer in the grid and trade with them instead
- Counter the dealer's quote. This initiates a back and forth with the dealer to negotiate a better price.
- Pass on the trade. This reverts the order back to its default staging status.
Trade done
Once the trader reaches a satisfactory price, they review the details of the trade and confirm. A trade executed card is then displayed, showing a final summary of the trade.
The workspace
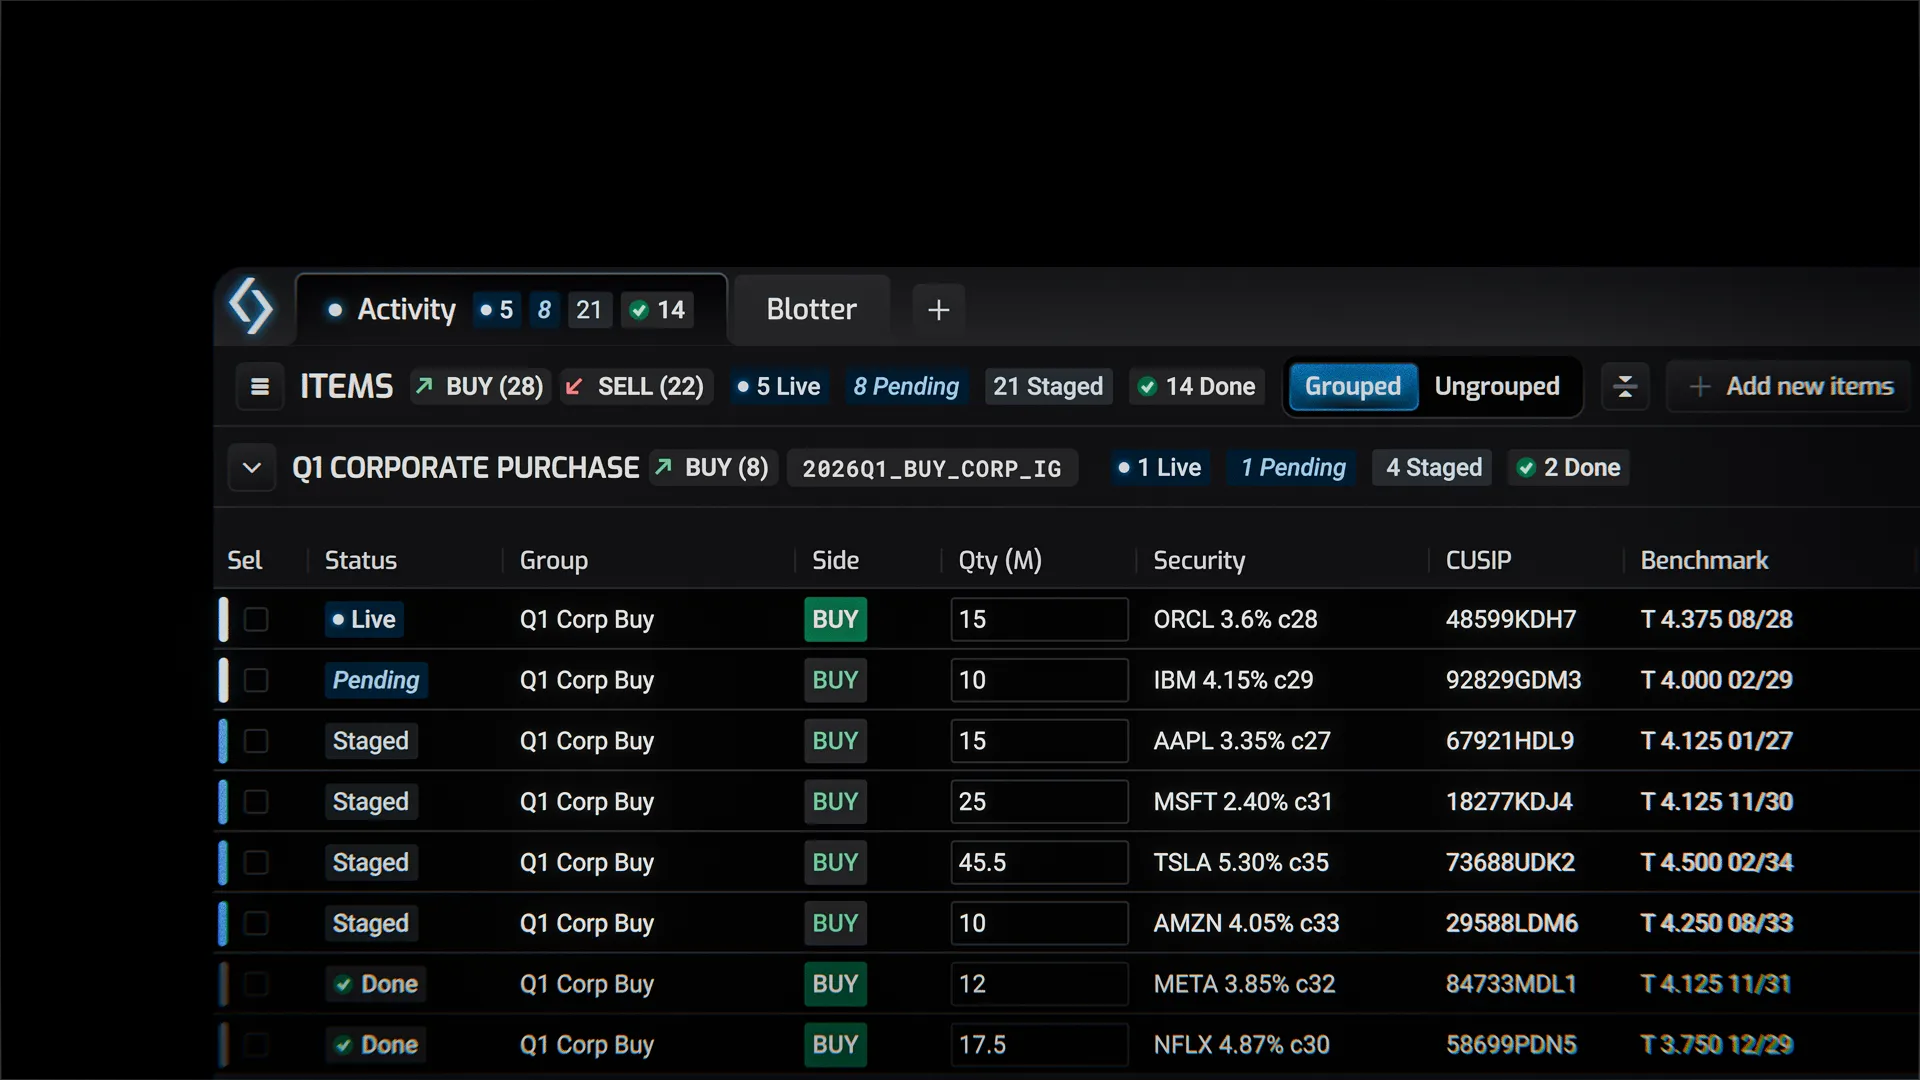
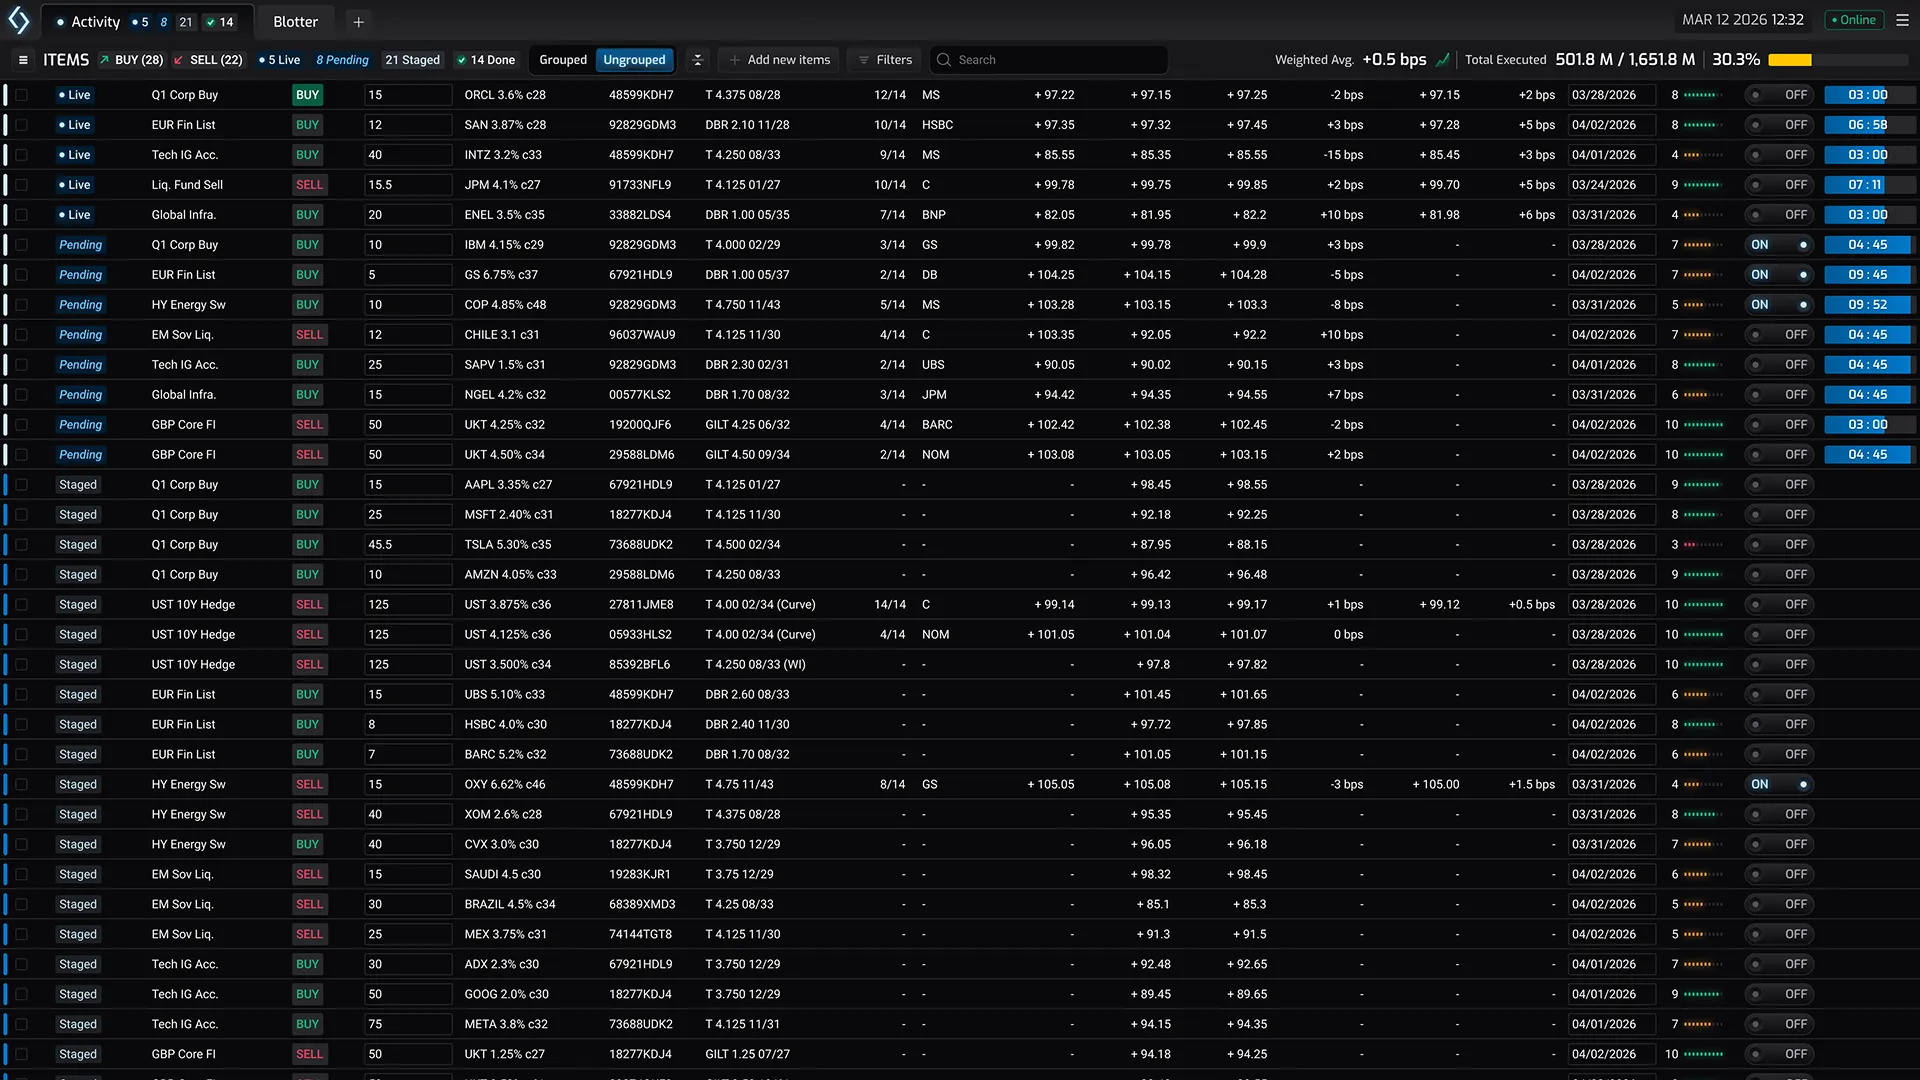
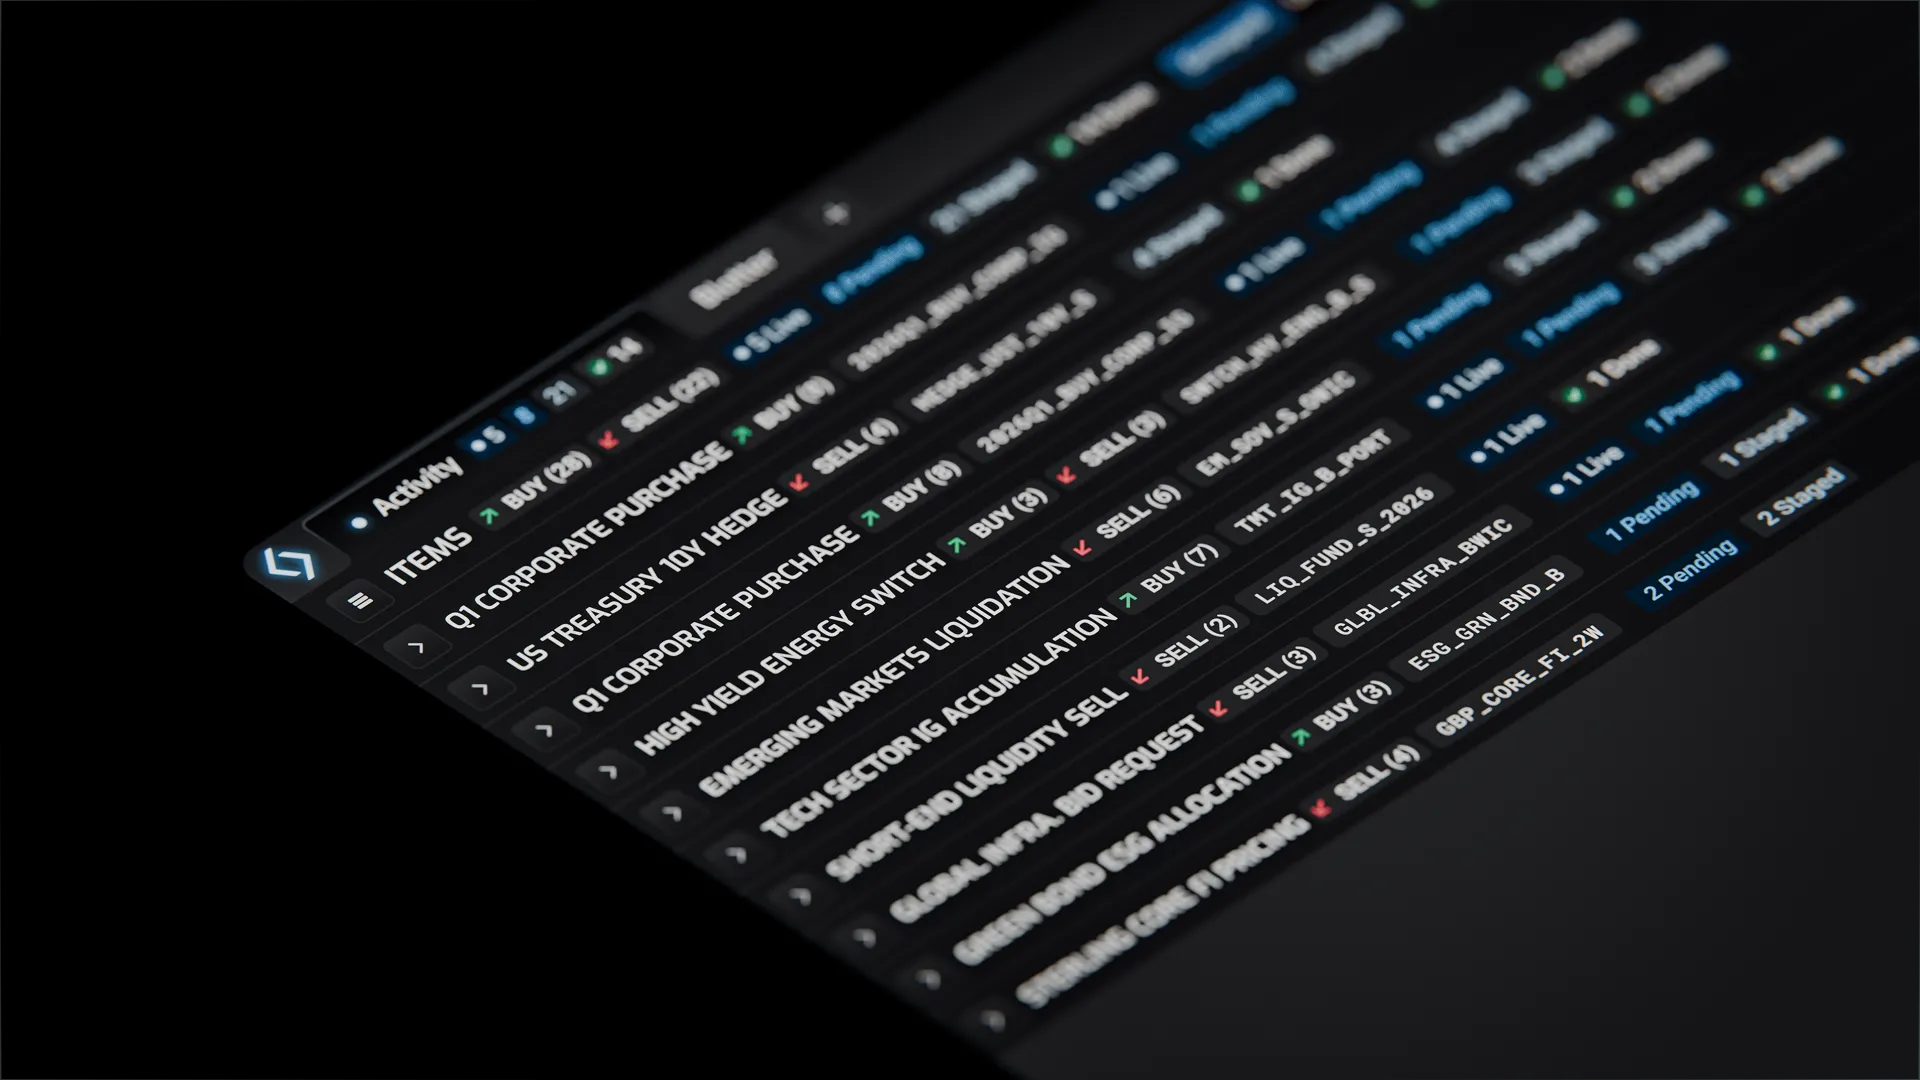
At the heart of the UI is the main grid. Think of it as today’s to-do list, with a few more bells and whistles. Each row represents a bond, and bonds are neatly organised into groups, and each group is ordered so bonds that require attention always sit at the top of a stack.
This is a dynamic and always shifting workspace, but the UI helps to keep a tab on the important details at the right moments; orders are colour-coded by status, a persistent pattern across the application; performance and trends are monitored on a heads-up display; and counterparty activity is displayed with impact so an opportunity is never missed.
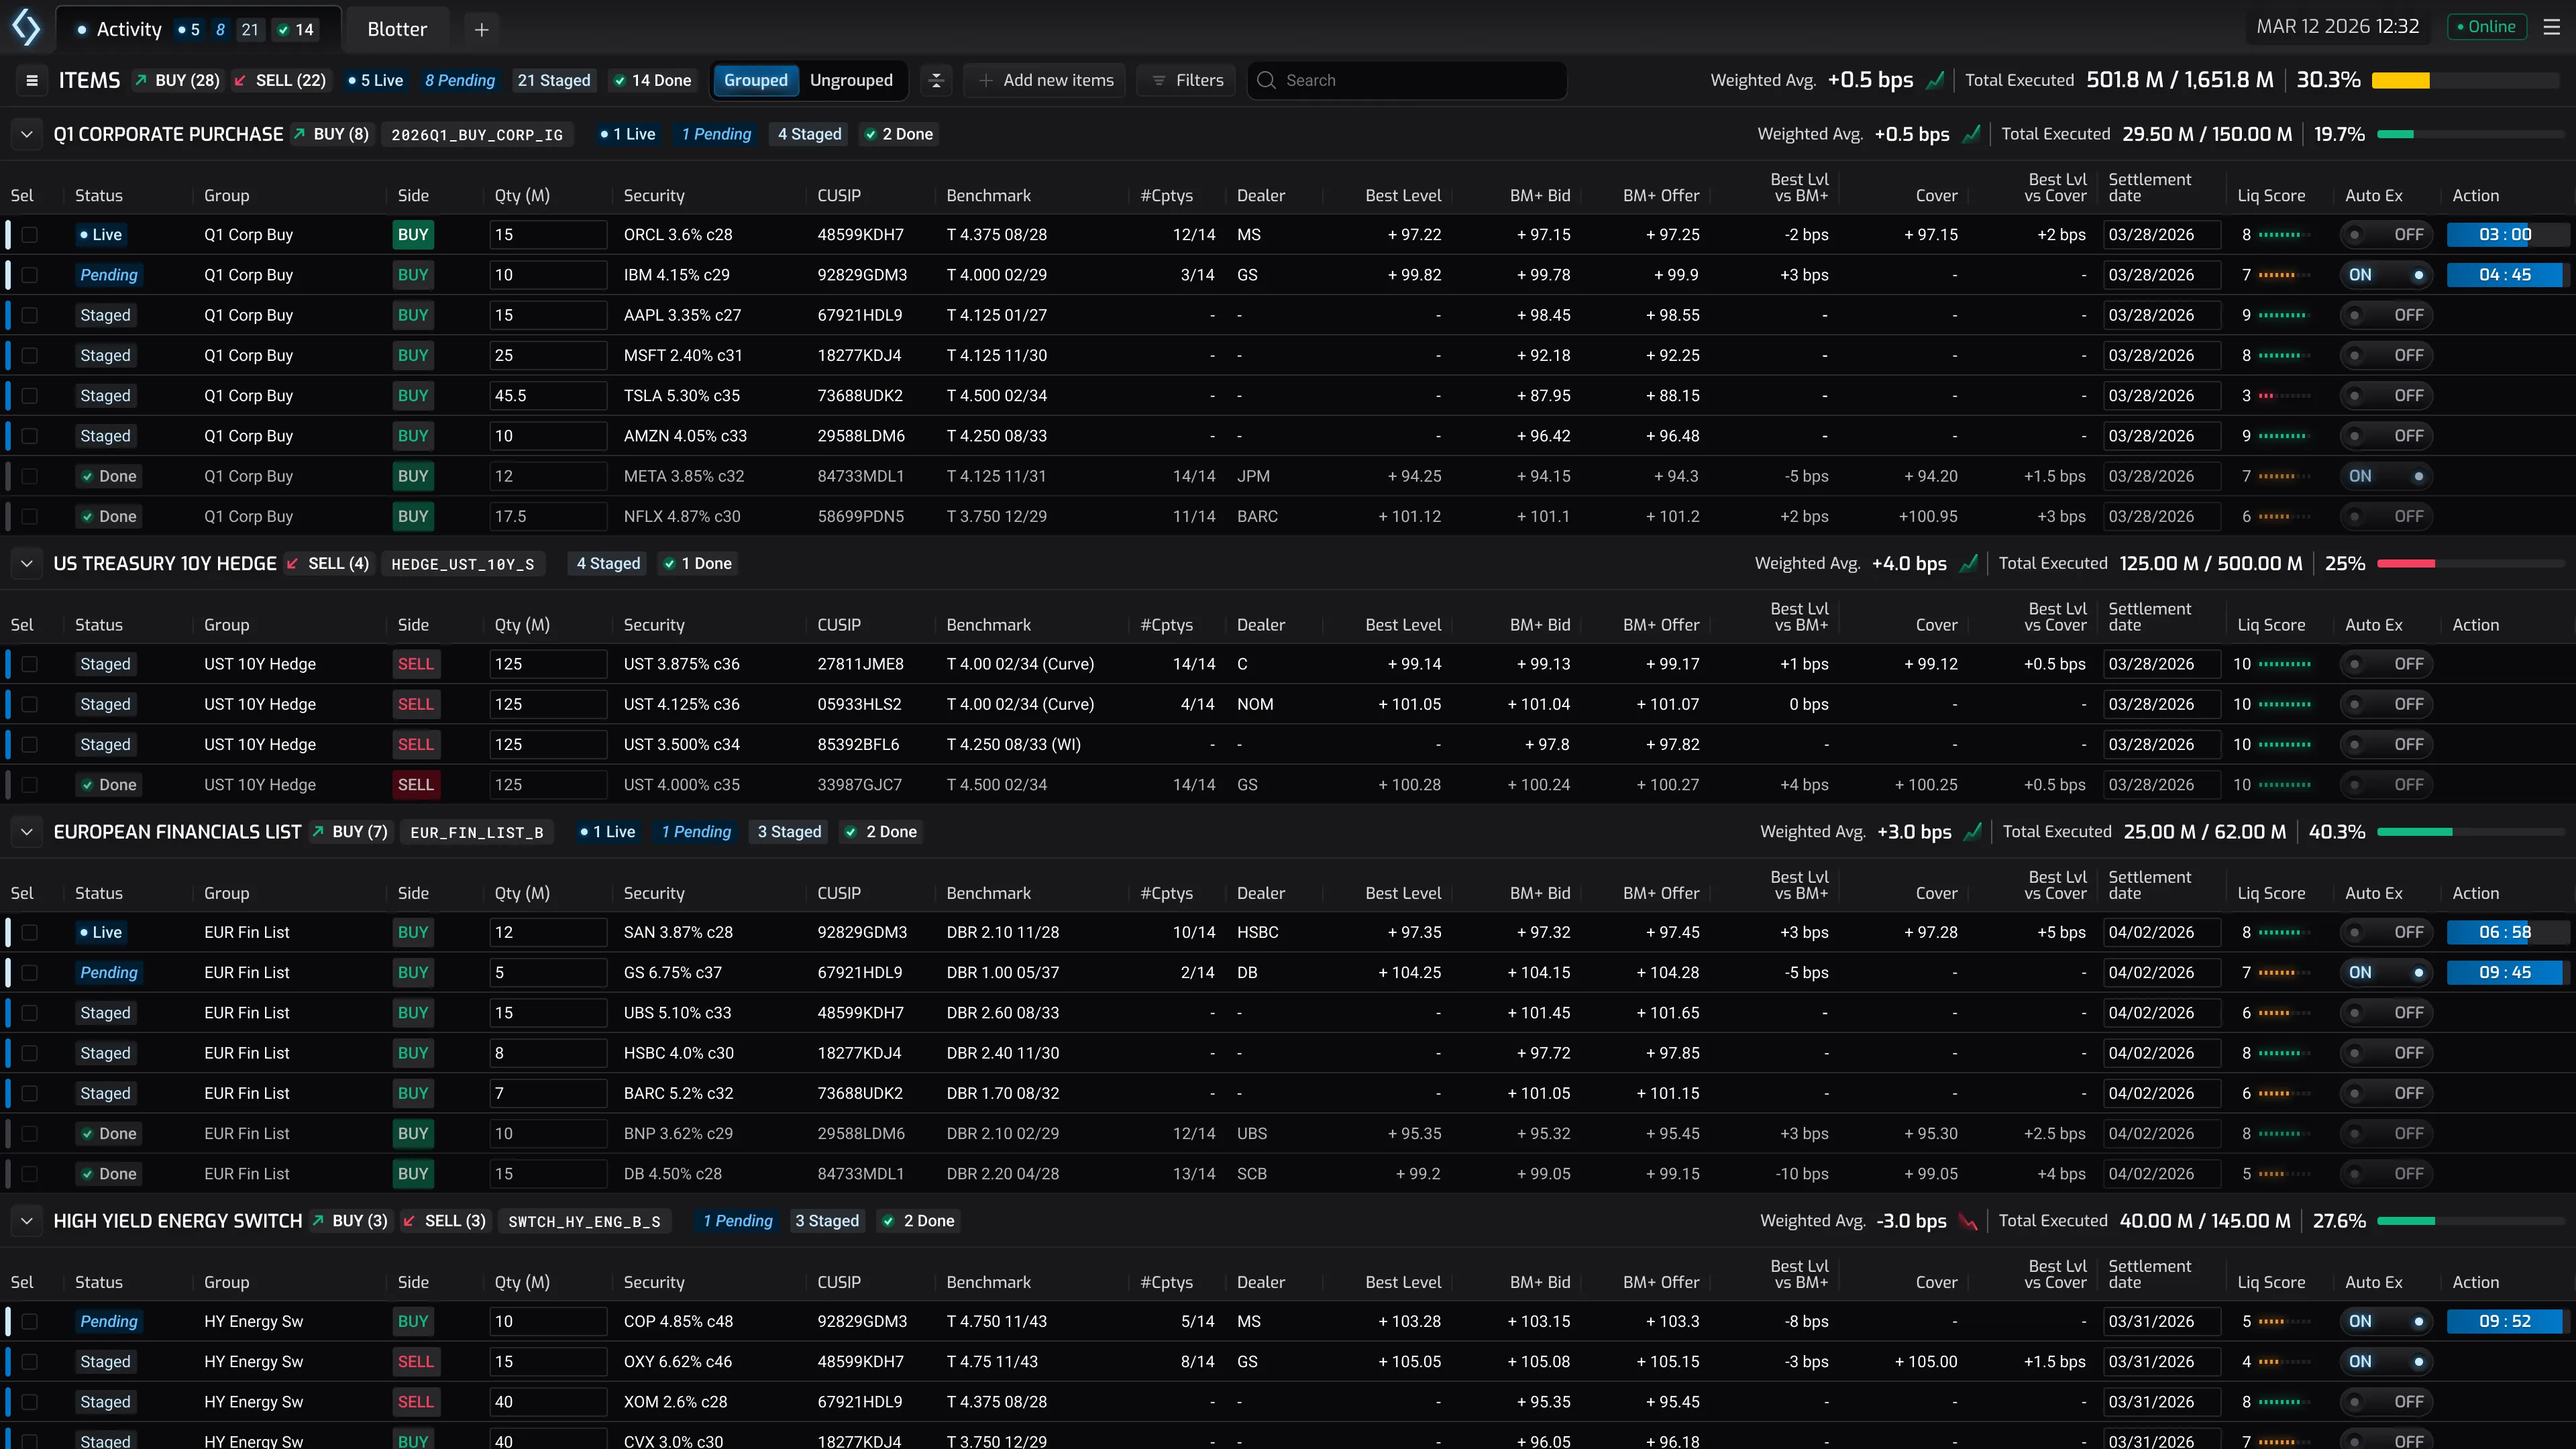
The main tab displays a simple overview of activity, so the trader can remain informed while taking on tasks in other workspaces.
Colour-coded pillars signal the exact stage of an order. By using a ‘possession-based’ logic, the UI tells the trader at a glance if they are waiting on a dealer or if it’s their turn to act.
The collapsible group header contains a summary of its contents, the status and sides of its orders. By default, the orders are grouped by sector, but there’s flexibility to group orders by status, currency, liquidity score etc.
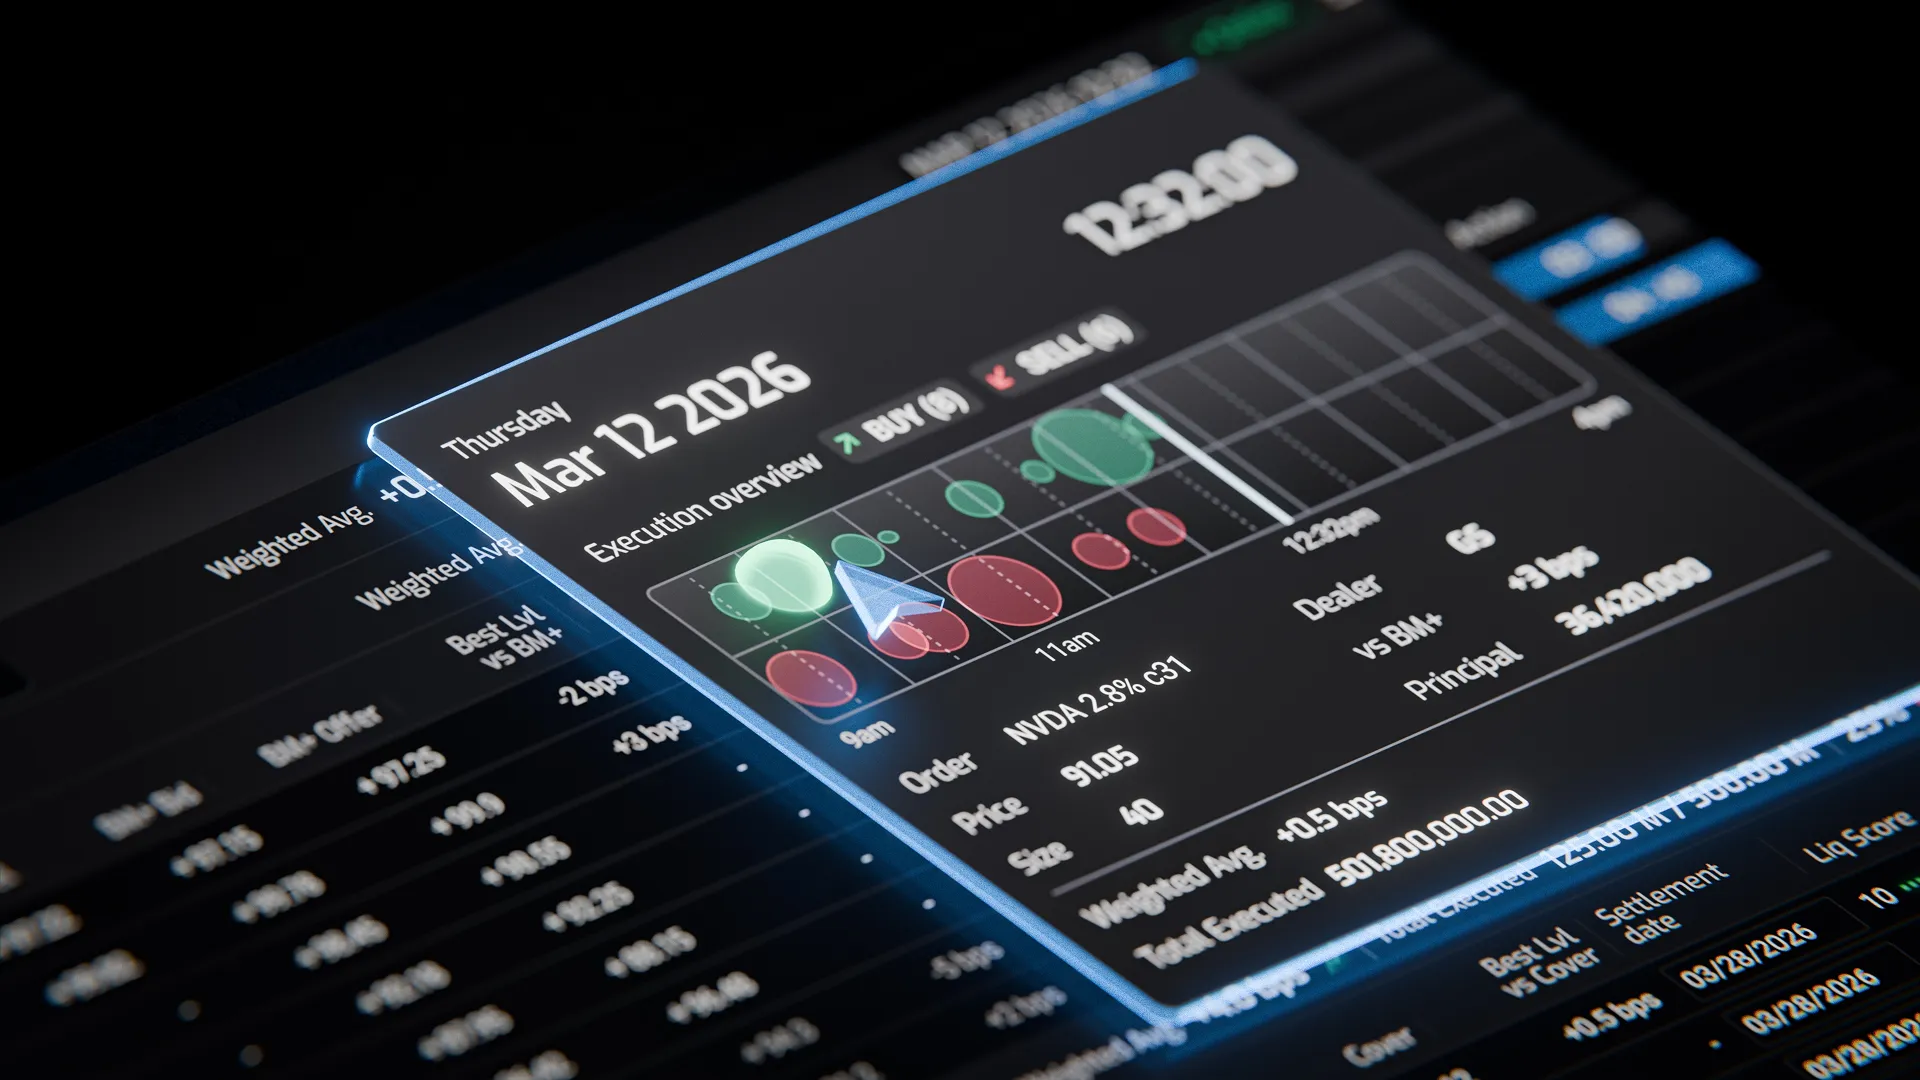
Clicking the date/time brings up the summary view. Here the trader can see a summary of orders executed so far on that day. The chart displays the time of execution, the side, and the size of the bubble represents the value of the trade.
Weighted averages and execution totals update instantly. This gives the user a view of their progress against daily goals at a glance.
When dealer responses start arriving, the response panel floods with activity - the red blocks indicate a response below benchmark and the green blocks indicate a response above benchmark.